


Table of Contents
Key Information & Summary of Mass Spectra and IR
- Mass spectrometry is based on the possibility of separating a mixture of ions as a function of their mass/charge ratio.
- The fragmentation pattern depends on the chemical structure and is typical for every molecule.
- The molecular structure can be determined by taking as reference the molecular ion and then analyzing the fragments or backwards (bottom-up).
- The peak corresponding to the ionized molecule is the molecular ion, it allows to establish the molecular weight of the analyte.
- Infrared spectroscopy or IR spectroscopy is a spectroscopic absorption technique that studies how the infrared radiation interacts with the matter.
- The energy that IR radiation generally correspond to the energy necessary to excite a vibration of a molecule.
- The vibrations can be mainly of two types: stretching of the chemical bond (stretching) and deformation of the binding angle (bending).
Mass spectrometry
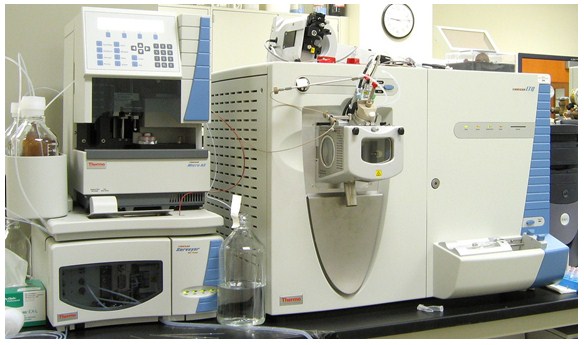
Mass spectrometry is an analytical technique that is used for both to the identification of unknown substances and to the detection of traces of substances. It is commonly used in combination with separative techniques, such as gas chromatography and liquid chromatography (HPLC) or, more recently, with techniques such as induction plasma.
It is a spectrometry, a technique that measure a specific spectrum. Do not confuse this with spectroscopy, that refers to the study of how light and matter interact.
Mass spectrometry is based on the possibility of separating a mixture of ions as a function of their mass/charge ratio. Generally the separation is done by means of a static or oscillating magnetic fields.
Fragmentation Pattern
First, the sample is ionized passing through a beam of electrons of known energy. The ionized fragmented molecules are unstable thus they break into lighter ions. The fragmentation pattern is depending of the chemical structure and is typical for every molecule.
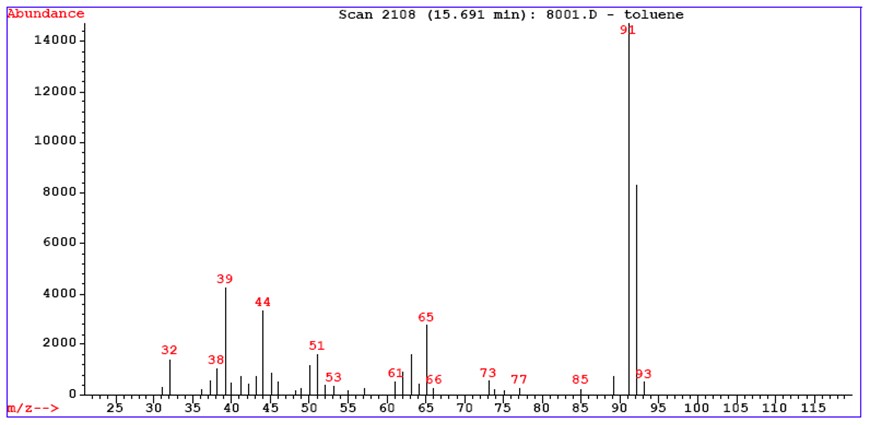
The diagram showing the abundance of each ion as a function of the mass/charge ratio is the so-called mass spectrum, typical of each compound as it is directly related to its chemical structure and to the ionization conditions to which it has been subjected.
In routine applications, spectra are normally represented as histograms that report the abundance of each ion as a function of its mass, reasonably assuming that all the ions produced by the analysis have a single charge.
The abundances are reported as a ratio to the base peak, which is the most abundant peak observed in the spectrum. This normalization allows to have spectra that are a function only of the analyte and of the conditions of analysis.
The molecular structure can be determined by taking as reference the molecular ion and then analyzing the fragments or backwards (bottom-up). The peak corresponding to the ionized molecule is the molecular ion, it allows to establish the molecular weight of the analyte.
Generally, the more a molecular ion is stabilized (by resonance as instance), the greater is the probability of reaching the detector intact. So a more stable peak will be more abundant in the spectrum. From the abundance of the parent peak it is possible to hypothesize to which class of compounds the analyte belongs. In the case of impact ionization at medium energies, we have:
about 0 to 10%: linear alkanes, alkyl halides, esters, alcohols, carboxylic acids
from about 10% to 50%: alkenes, conjugated polyenes, aldehydes, ketones, ethers
from about 50% to 100%: aromatic compounds, cycloalkanes, mercaptans
If you want to increase the parent peak abundance, you need to either reduce the energy used in impact ionization or resort to soft ionization techniques such as chemical or field ionization.
The number of peaks observed in a mass spectrum is always greater than that one of the fragments produced by the analysis, because each peak is accompanied by satellite peaks, produced by ions containing isotopes of the various elements. Since the average ratios between the different amounts of isotopes of the same element in nature are known and substantially constant, from the abundance of the satellite peaks it is possible to obtain information that allows to hypothesize the brute formula of the analyte.
Infrared spectroscopy or IR spectroscopy
Infrared spectroscopy or IR spectroscopy is a spectroscopic absorption technique that study how the infrared radiation interacts with the matter.
It is normally used in analytical chemistry, as well as in physical chemistry for the study of chemical bonds.
Infrared radiation (IR) is a range of electromagnetic waves with longer wavelengths than those of visible light, 7 from 700 nanometers to 1 millimeter (300 GHz). The energy that IR radiation carries generally corresponds to the energy necessary to excite a vibration of a molecule.
From the infrared spectrum it is possible to obtain useful information for the recognition of an unknown molecule. In this regard, in order to associate a peak to a given wave number, appropriate tables are used in the bibliography or electronic libraries included in the instrumentation software.
For vibration we mean an oscillation of the atoms inside a molecule around an equilibrium point (not excited state.
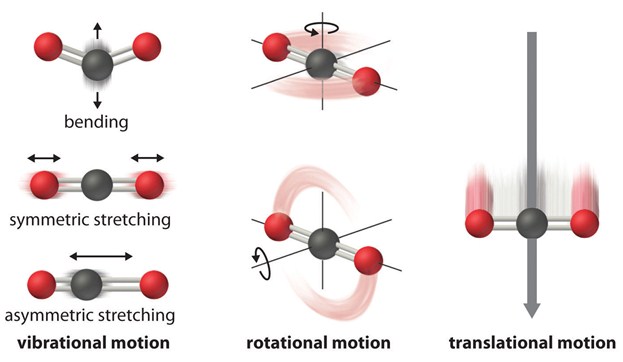
The vibrations can be of two types: stretching of the chemical bond (stretching) and deformation of the binding angle (bending). Stretching consists of a periodic variation of the interatomic distance and can be symmetrical if the two atoms approach or distance simultaneously. The deformation may also be symmetrical or asymmetric and may take place along the plane on which the binding angle lies, or outside that plane. The symmetrical deformation in the plane is called scissoring (opening and closing of a scissor, indicated with δ), while the asymmetric deformation is called rocking (oscillation, indicated with ρ); the asymmetric deformation outside the plane is called twisting (torsion, indicated with τ) while the symmetrical deformation outside the plane is called wagging (agitation, indicated with the letter w).
Considering a linear molecule formed by N atoms, according to the orientation along the three Cartesian axes (x, y, z), 3N-5 different vibrational modes are possible.
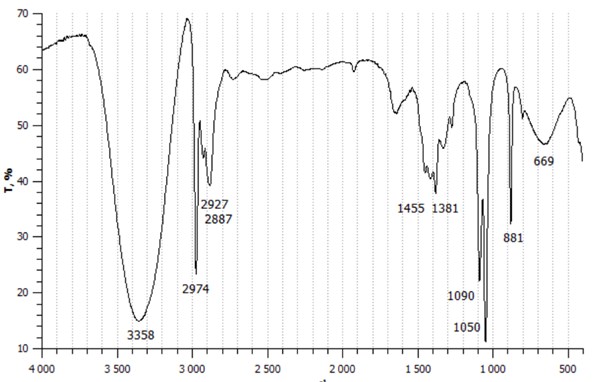
In a typical infrared spectrum in the abscissa we find a scale of frequencies expressed in wave number, ie quantity of waves per centimeter, and in ordinate the percentage of transmittance.
If a material is transparent to infrared radiation, its spectrum will be presented as a line parallel to the abscissa axis. If a material is not completely transparent, absorptions and therefore transitions between vibrational energy levels will occur. In this second case the recorded spectrum will be characterized by a series of peaks of varying height for each transition. Here the IR spectrum of ethanol:
Read more about infrared spectroscopy
The spectrum can be divided into three different zones:
From 3800 to 1300 cm-1, functional groups and includes bands due both to stretches and to deformations of functional groups (e.g., NH, OH, CH, C = C, C = O, N = O, etc.). The hydrogen peaks are at very high frequencies due to the very small mass of this atom.
From 1300 to 650 cm-1, area of fingerprints, bands strictly characteristic of each single molecule.
From 650 to 200 cm-1, area of the far IR, which extends and presents bands due to strains of heavy atoms, deformations of groups without hydrogen and skeleton vibrations.
Frequently Asked Questions
What are mass spectra?
A mass spectrum is a plot of data between the m/z ratios of the ions against their intensities. Each peak in a mass spectrum depicts a unique m/z in the sample (a specific ion), and the heights of the peaks show the relative abundance of the different components in the sample.
What is mass spectrometry?
Mass spectrometry is an analytical technique used in chemistry to separate different ionic species (atomic or molecular) based on their mass-to-charge ratio (m/z ratio).
How are mass spectra obtained?
A mass spectrum is plotted by a specific instrument called a mass spectrometer. Different ions get separated based on their mass-to-charge ratio (m/z) and hit a detector that amplifies the minute electric currents to plot the data.
Why are mass spectra important?
Mass spectra give an idea about the molecular weight of the different ions and help to identify different isotopes. It's also a useful tool for studying molecular structure.
References and further readings:
https://en.wikipedia.org/wiki/Mass_spectrometry#/media/File:Mass_Spectrometer_Schematic.svg
https://www.youtube.com/watch?v=tOGM2gOHKPc
https://www.youtube.com/watch?v=2oPUyIbPxLo
Infrared Spectroscopy: Fundamentals and Applications, Barbara H. Stuart, ISBN: 978-0-470-85428-0