


Table of Contents
Key Information & Summary
- Confidence limits show how accurate an estimation of the mean is, or is likely to be
- Confidence intervals show the range in which the true value is likely to fall within
- Confidence intervals are based on the point estimate, the confidence level required, and the standard error of the point estimate
What are confidence limits?
In short, confidence limits show how accurate an estimation of the mean is or is likely to be. Confidence limits are the lowest and the highest numbers at the end of a confidence interval.
Confidence intervals
A confidence interval is a range in which the true value is likely to fall in. These values are based on the data which is used in the statistical analysis. Confidence intervals are based on three things:
- The point estimate – for example, the same mean
- The confidence level needed – this is normally 95%, but can be anywhere between 0 and 100%
- The standard error of the point estimate
A point estimate is a value which has been calculated from the observed data in order to estimate the true value of an unknown parameter. They are, essentially, an educated guess at the value of an unknown parameter. Confidence intervals try to reflect the errors that may occur when the statistical analysis is based on random and limited samples. They try to determine just how wrong these estimates may be. For example, statisticians often use the sample mean, denoted by x (and unbiased estimate), to estimate the population mean, denoted by µ.
We use something called the margin of error to calculate the maximum amount that a point estimate can be wrong at a certain confidence interval. The margin of error is calculated using the following equation:
![]()
In the above equation:
- σ is the standard deviation of the population
- n is the sample size
- z is the z value which corresponds to the required level of confidence
Z values are obtained from a statistical table. A small portion of this table is shown below and contains the z values which are most commonly used in statistical analysis.
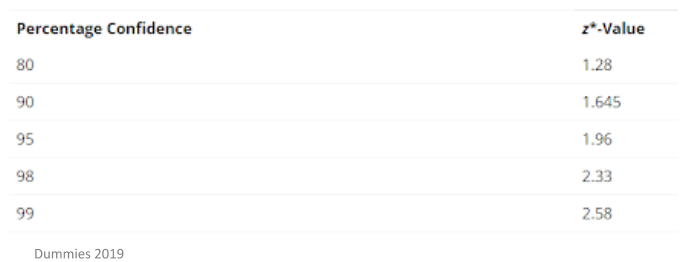
As stated above, confidence levels are usually chosen to be 95% when conducting statistical analysis. Put simply, this means that if you were to take 100 samples with a 95% confidence level for each of the samples, then roughly 95 of those confidence intervals will contain the true mean value – this is represented by the symbol µ. The 95% confidence interval reflects the level of random error and comes up with a range of values which are likely to include true mean value.
You can calculate the confidence interval using the following formula:
confidence interval = point estimate ± margin of error
You can calculate a confidence interval through a step-by-step approach:
- Work out the mean of all the samples
- Work out the standard deviation of these samples – it is best to use the standard deviation of the whole population, but if you don’t have access to this, you can use the standard deviation of your samples
- Choose which confidence interval you want to use – this is most commonly 95% or 99%, but you can choose others if you wish
- Find the z value for your desired confidence interval – as discusses, this comes from a set statistical table
- Put all of this information into the following equation:
![]()
Or put more formally:![]()
Once the confidence interval has been calculated, it is standard custom to write it out in full. This is usually done in the following way:
“The range of plausible values for ___, at ___% confidence, if from ___ to ___.”
You need to know that this is not the same as saying there is a certain chance that the true value lies between certain values. This is because we don’t know if a specific confidence interval will contain the parameter, we only know there is a chance that a random confidence interval will.
Confidence intervals can also be one-sided. This is where you are only interested in an upper limit or a lower limit for the population mean. An upper confidence interval is referred to as a right-sided confidence interval. As such, a lower confidence interval is referred to as a left-sided confidence interval. You can use this approach in situations where you need to know is the unknown mean is more or less than a specific value (as opposed to using a two-sided confidence interval where you need to know if the unknown mean is equal to that specific value).
Important features of confidence intervals
There are some very important features of confidence intervals that you may need to know. These are:
- If you want to increase the confidence, you will need to increase the interval
- The smaller the sample size is, the larger the intervals will be
- Confidence intervals can be used to test a hypothesis about the data set
References and further readings:
[1]. https://www.mathsisfun.com/data/confidence-interval.html
[2]. http://www.stat.yale.edu/Courses/1997-98/101/confint.htm